Visualize hierarchical estimates
| components | ||
| data | ||
| pages | ||
| public | ||
| styles | ||
| .gitignore | ||
| LICENSE.txt | ||
| netlify.toml | ||
| package.json | ||
| postcss.config.js | ||
| README.md | ||
| tailwind.config.js | ||
| yarn.lock | ||
About
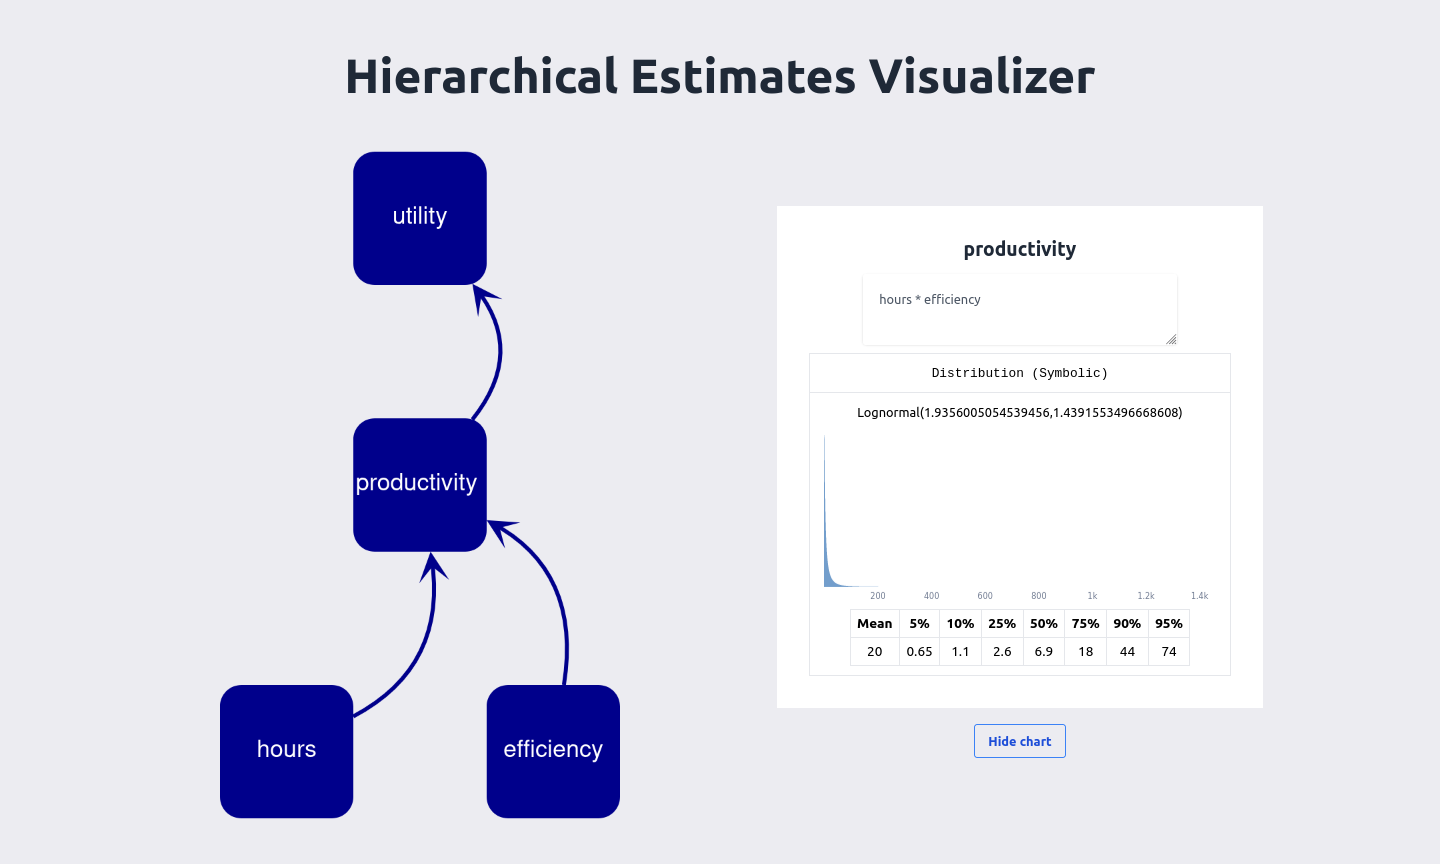
This repository displays hierarchical estimates. It presents the user with a tree with nodes which can be clicked on and inspected, which visualizes the underlying squiggle calculation.
So far, this mostly has visualization capabilities, meaning that edits are impermanent.
If you want to use the utility function extractor for a project, we are happy to add a page for your project, like hierarchical-estimates.netlify.app/your-project.
Built with
Usage
Navigate to hierarchical-estimates.netlify.app (to do: point to subdomain), and start visualizing.
Contributions and help
We welcome PR requests.
License
Distributed under the MIT License. See LICENSE.txt for more information.
To do
- Allow for edits.
- Change tailwinds to display stuff side by side, rather than at the bottom