9.5 KiB
Analysis of some predictions about the 2018 EA Survey
Introduction.
A group of effective altruism community leaders made predictions about the 2018 EA Community Survey. Here, I analyze how well calibrated they are. I present the main result first because most people just skim stuff. If readers remain interested, I then outline the set up for the prediction making, present the questions, and explain some judgement calls I made when judging the answers. Everything is written such that you can play along. At the end, I provide some code to replicate my analysis. The data was given to me by David Nash.
Results
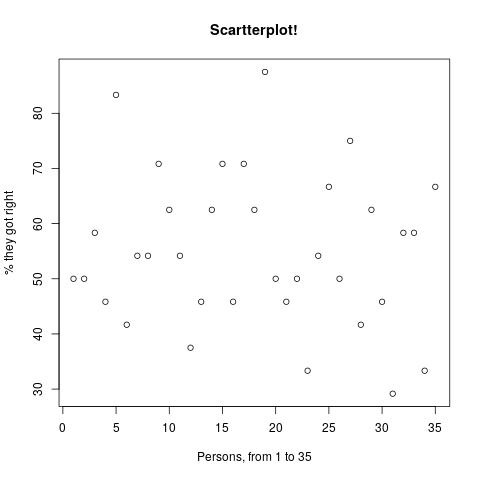
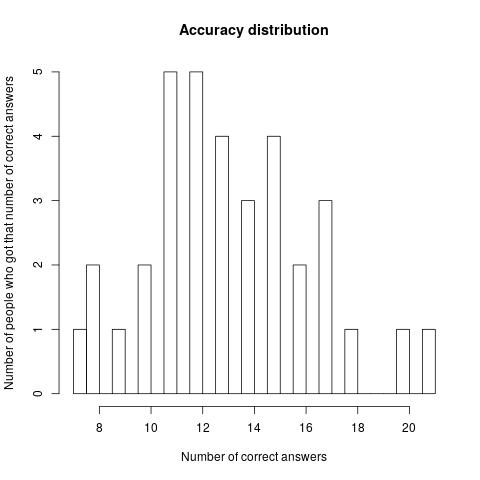
For the 35 people who took part in the original prediction making, their results can be seen in the following graphics:
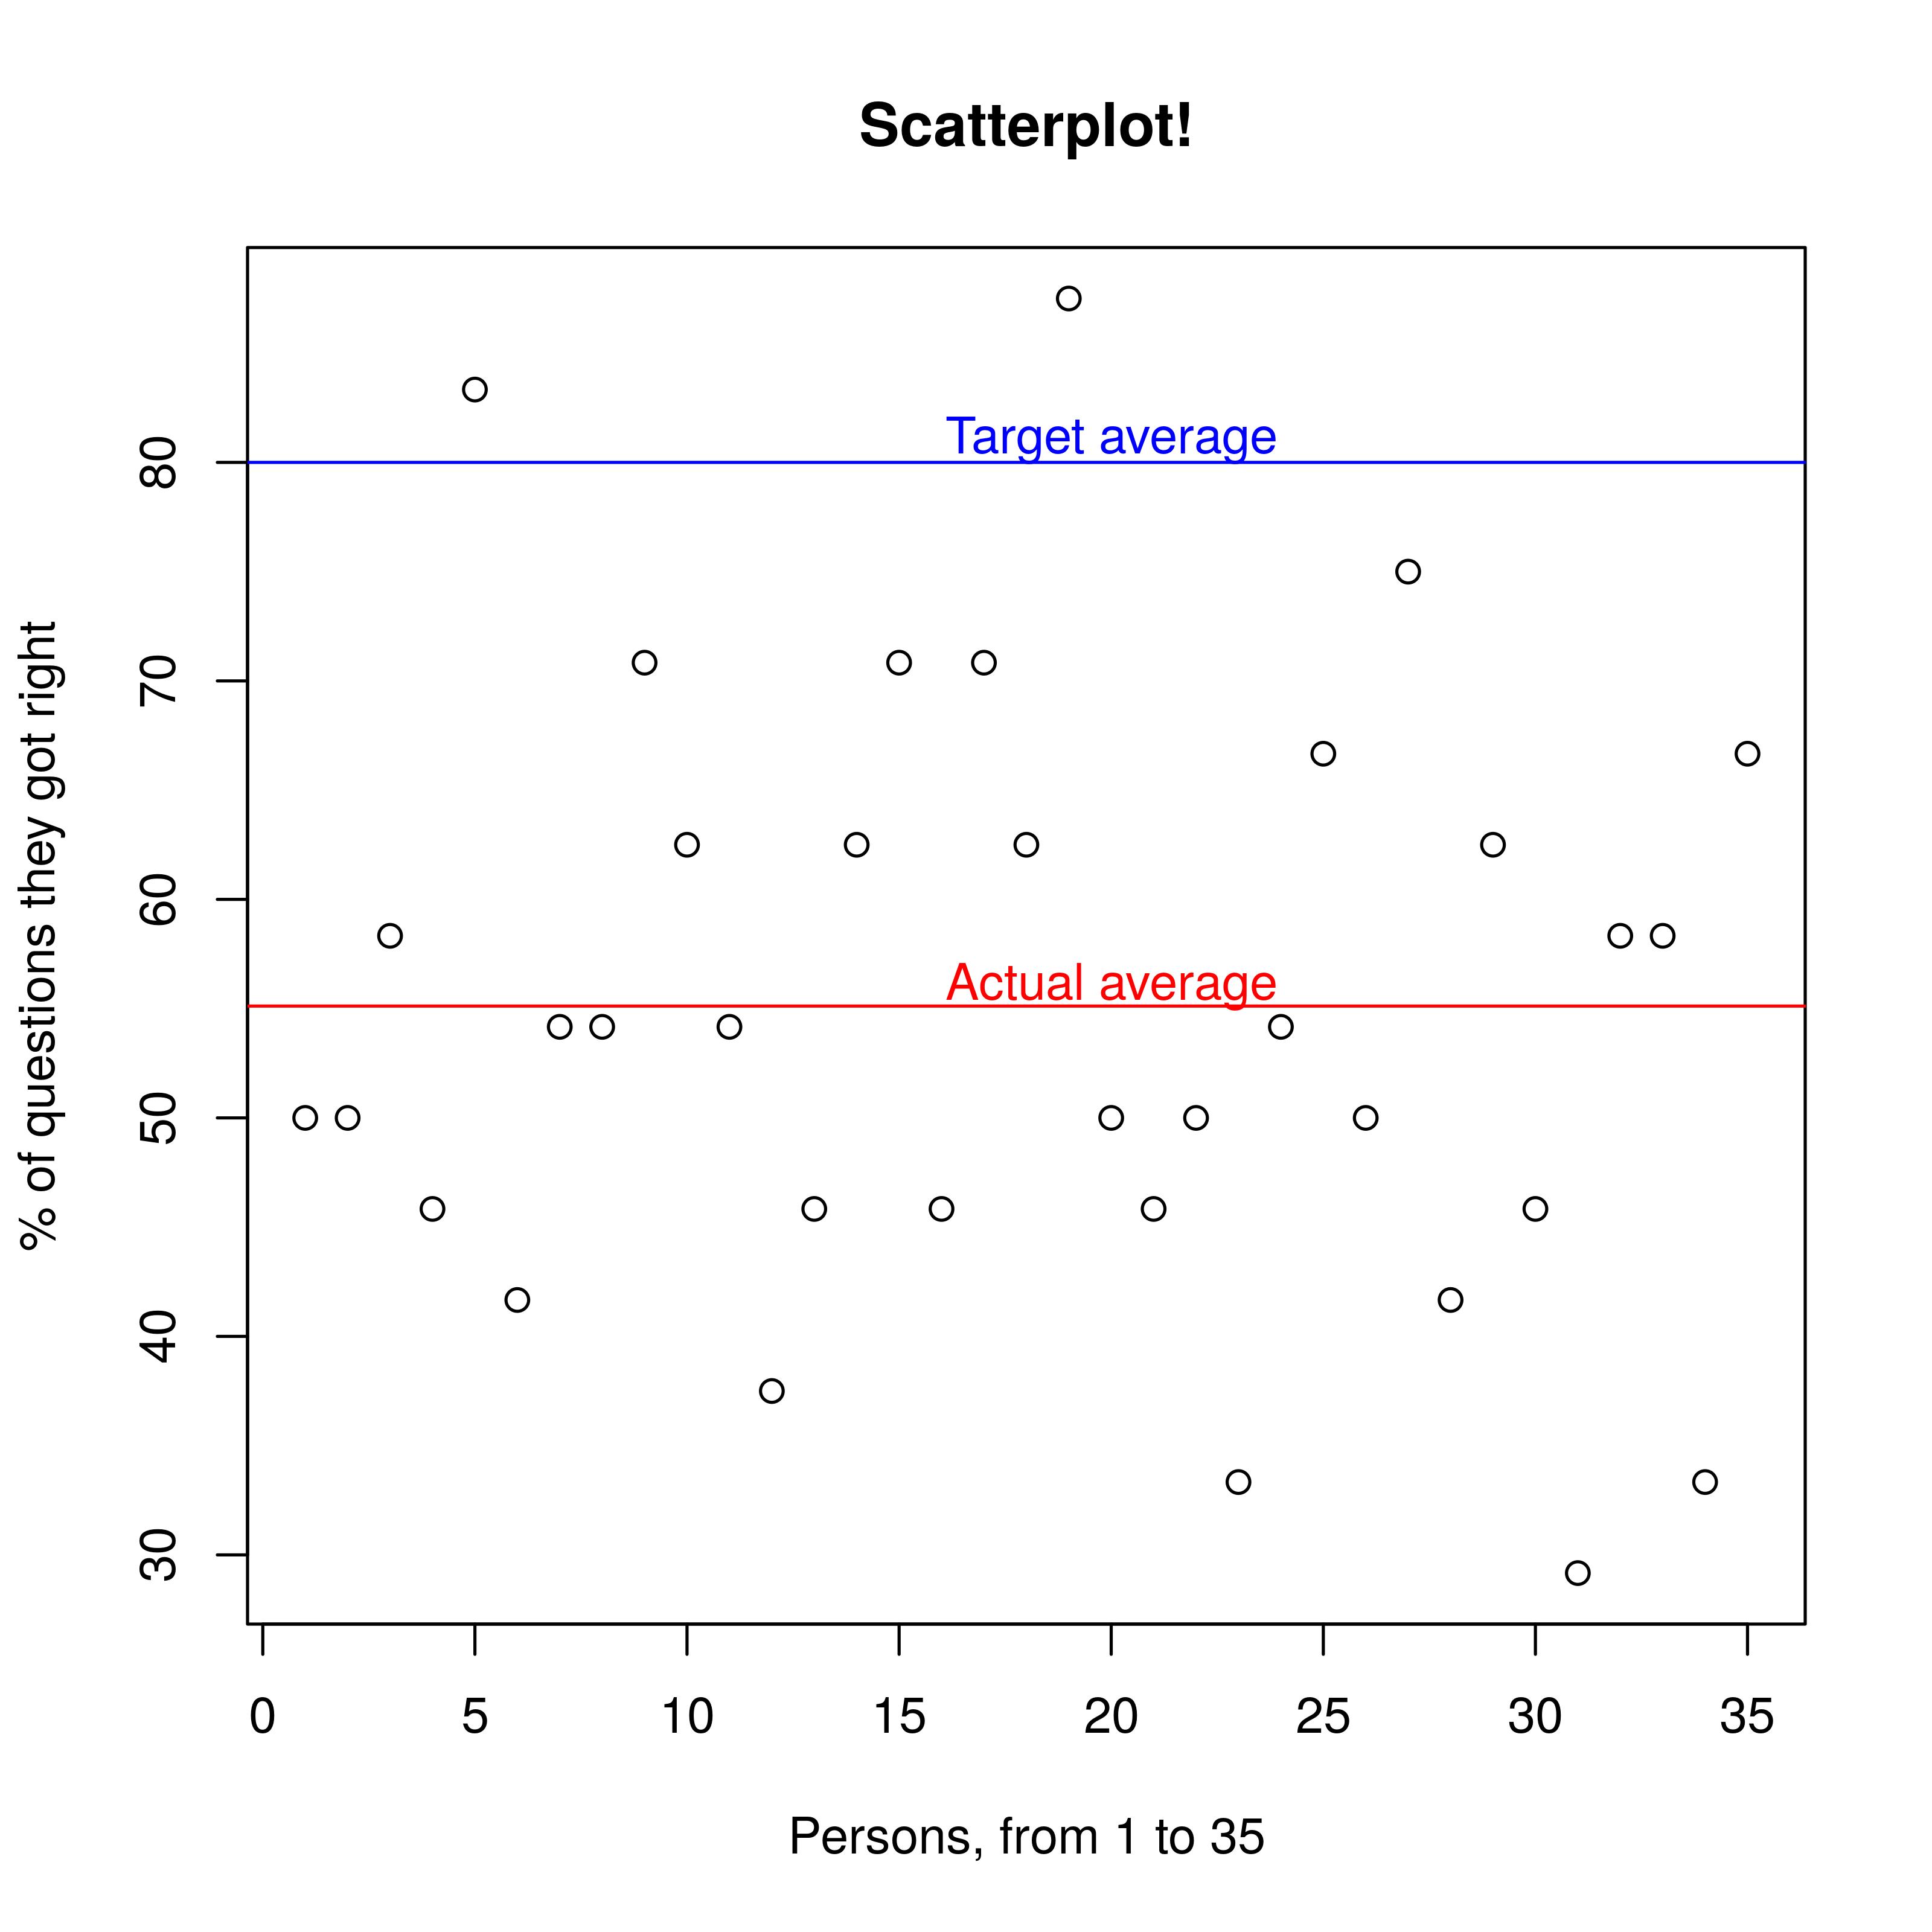
The average accuracy is 55.12%, that is, the average participant got 13.22 out of 24 questions right. If it had been reached, a target credence of 80% would imply an average of 19.2 correct answers. In other words, when EA Community leaders say 80%, the thing happens 55% of the time. If they bet, they'd be replacing ~1:1 bets with 1:4 bets.
Set up
For every question, try to come up with an interval such that you're 80% confident the answer lies in it. If you use a search engine, the surveys from previous years are fair game.
Judgement call
In some cases, people didn't answer the question. For example, under the is.veg variable, you can have TRUE, FALSE, or NA: Not Available. If their number is respectively x, y and z, it might be a good first order approximation to estimate the actual proportion of vegetarians/vegans as x/(x+y).
However, I've decided to be extremely anal about it, and choose to define the actual proportion of people who define as vegan as x/(x+y+z). I think that to do otherwise would be to replace questions. This doesn't make much of a difference in the case of plant eating, but it does in the identity politics questions. Curiously, doing so raises the average number of questions participants got right, but not by much.
Finally, I was told that the total number of people who answered the survey as 2607, so in the previous example, x+y+z := 2607. I stuck by 2607, yet the database I work with only has 2601 datapoints. I don't think this makes much of a difference either way.
Questions
-
How many people do you think will take the EA survey?
-
What percent of people will say they got involved in EA in 2017?
-
What percent of people will say they first heard about EA from a personal contact?
-
What percent of people will say they first heard about EA from LessWrong?
-
What percent of people will say they are involved in a local EA group?
-
What percent of people will say they have taken the Giving What We Can pledge?
-
What percent of people will say they find the EA community either welcoming or very welcoming?
-
What percent of people will say they find the EA community either unwelcoming or very unwelcoming?
-
What percent of people will say that global poverty should be the top or near top priority?
-
What percent of people will say that cause prioritisation should be the top or near top priority?
-
What percent of people will say that reducing risks from AI should be the top or near top priority?
-
What percent of people will say that animal welfare/rights should be the top or near top priority?
-
What percent of people will say that meta charities should be the top or near top priority?
-
What percent of people who took the survey will be between 20 and 35 years of age?
-
What percent of people will identify as male?
-
What percent of people will identify as white?
-
What percent of people will say they live in the US or UK?
-
What percent of people will say they live in continental Europe?
-
What percent of people will say they are atheist, agnostic or non-religious?
-
What percent of people will say they are vegan or vegetarian?
-
What percent of people will say they are politically on the left or centre left?
-
What percent of people will say they are politically on the centre?
-
What percent of people will say they are politically on the right or centre right?
-
What percent of people will say that they are single?
-
What percent of people will say that they are employed?
-
What percent of people will say that they are a student?
Answers
I got this answers using R from the data released by the EA survey people, available at this link. This allowed me to get a high level of precision, which was useful, because then I didn't have to care about whether the intervals were open or closed. For example, if someone gives an interval of (60,90), and the answer is 60, do I count it as right? If instead of 60 I have 59.76, I don't have to think about that problem.
- 22.20943613
- 33.17990027
- 11.73762946
- 15.53509781
- 25.77675489
- 59.37859609
- 4.75642501
- 61.33486766
- 41.46528577
- 44.1503644
- 35.28960491
- 34.06214039
- NA
- 59.76217875
- 78.17414653
- 52.35903337
- NA
- 72.0751822
- 38.43498274
- 60.98964327
- 8.630609896
- 2.685078634
- 35.82662064
- 52.5508247
- 26.50556195
Other ways to break down the results:
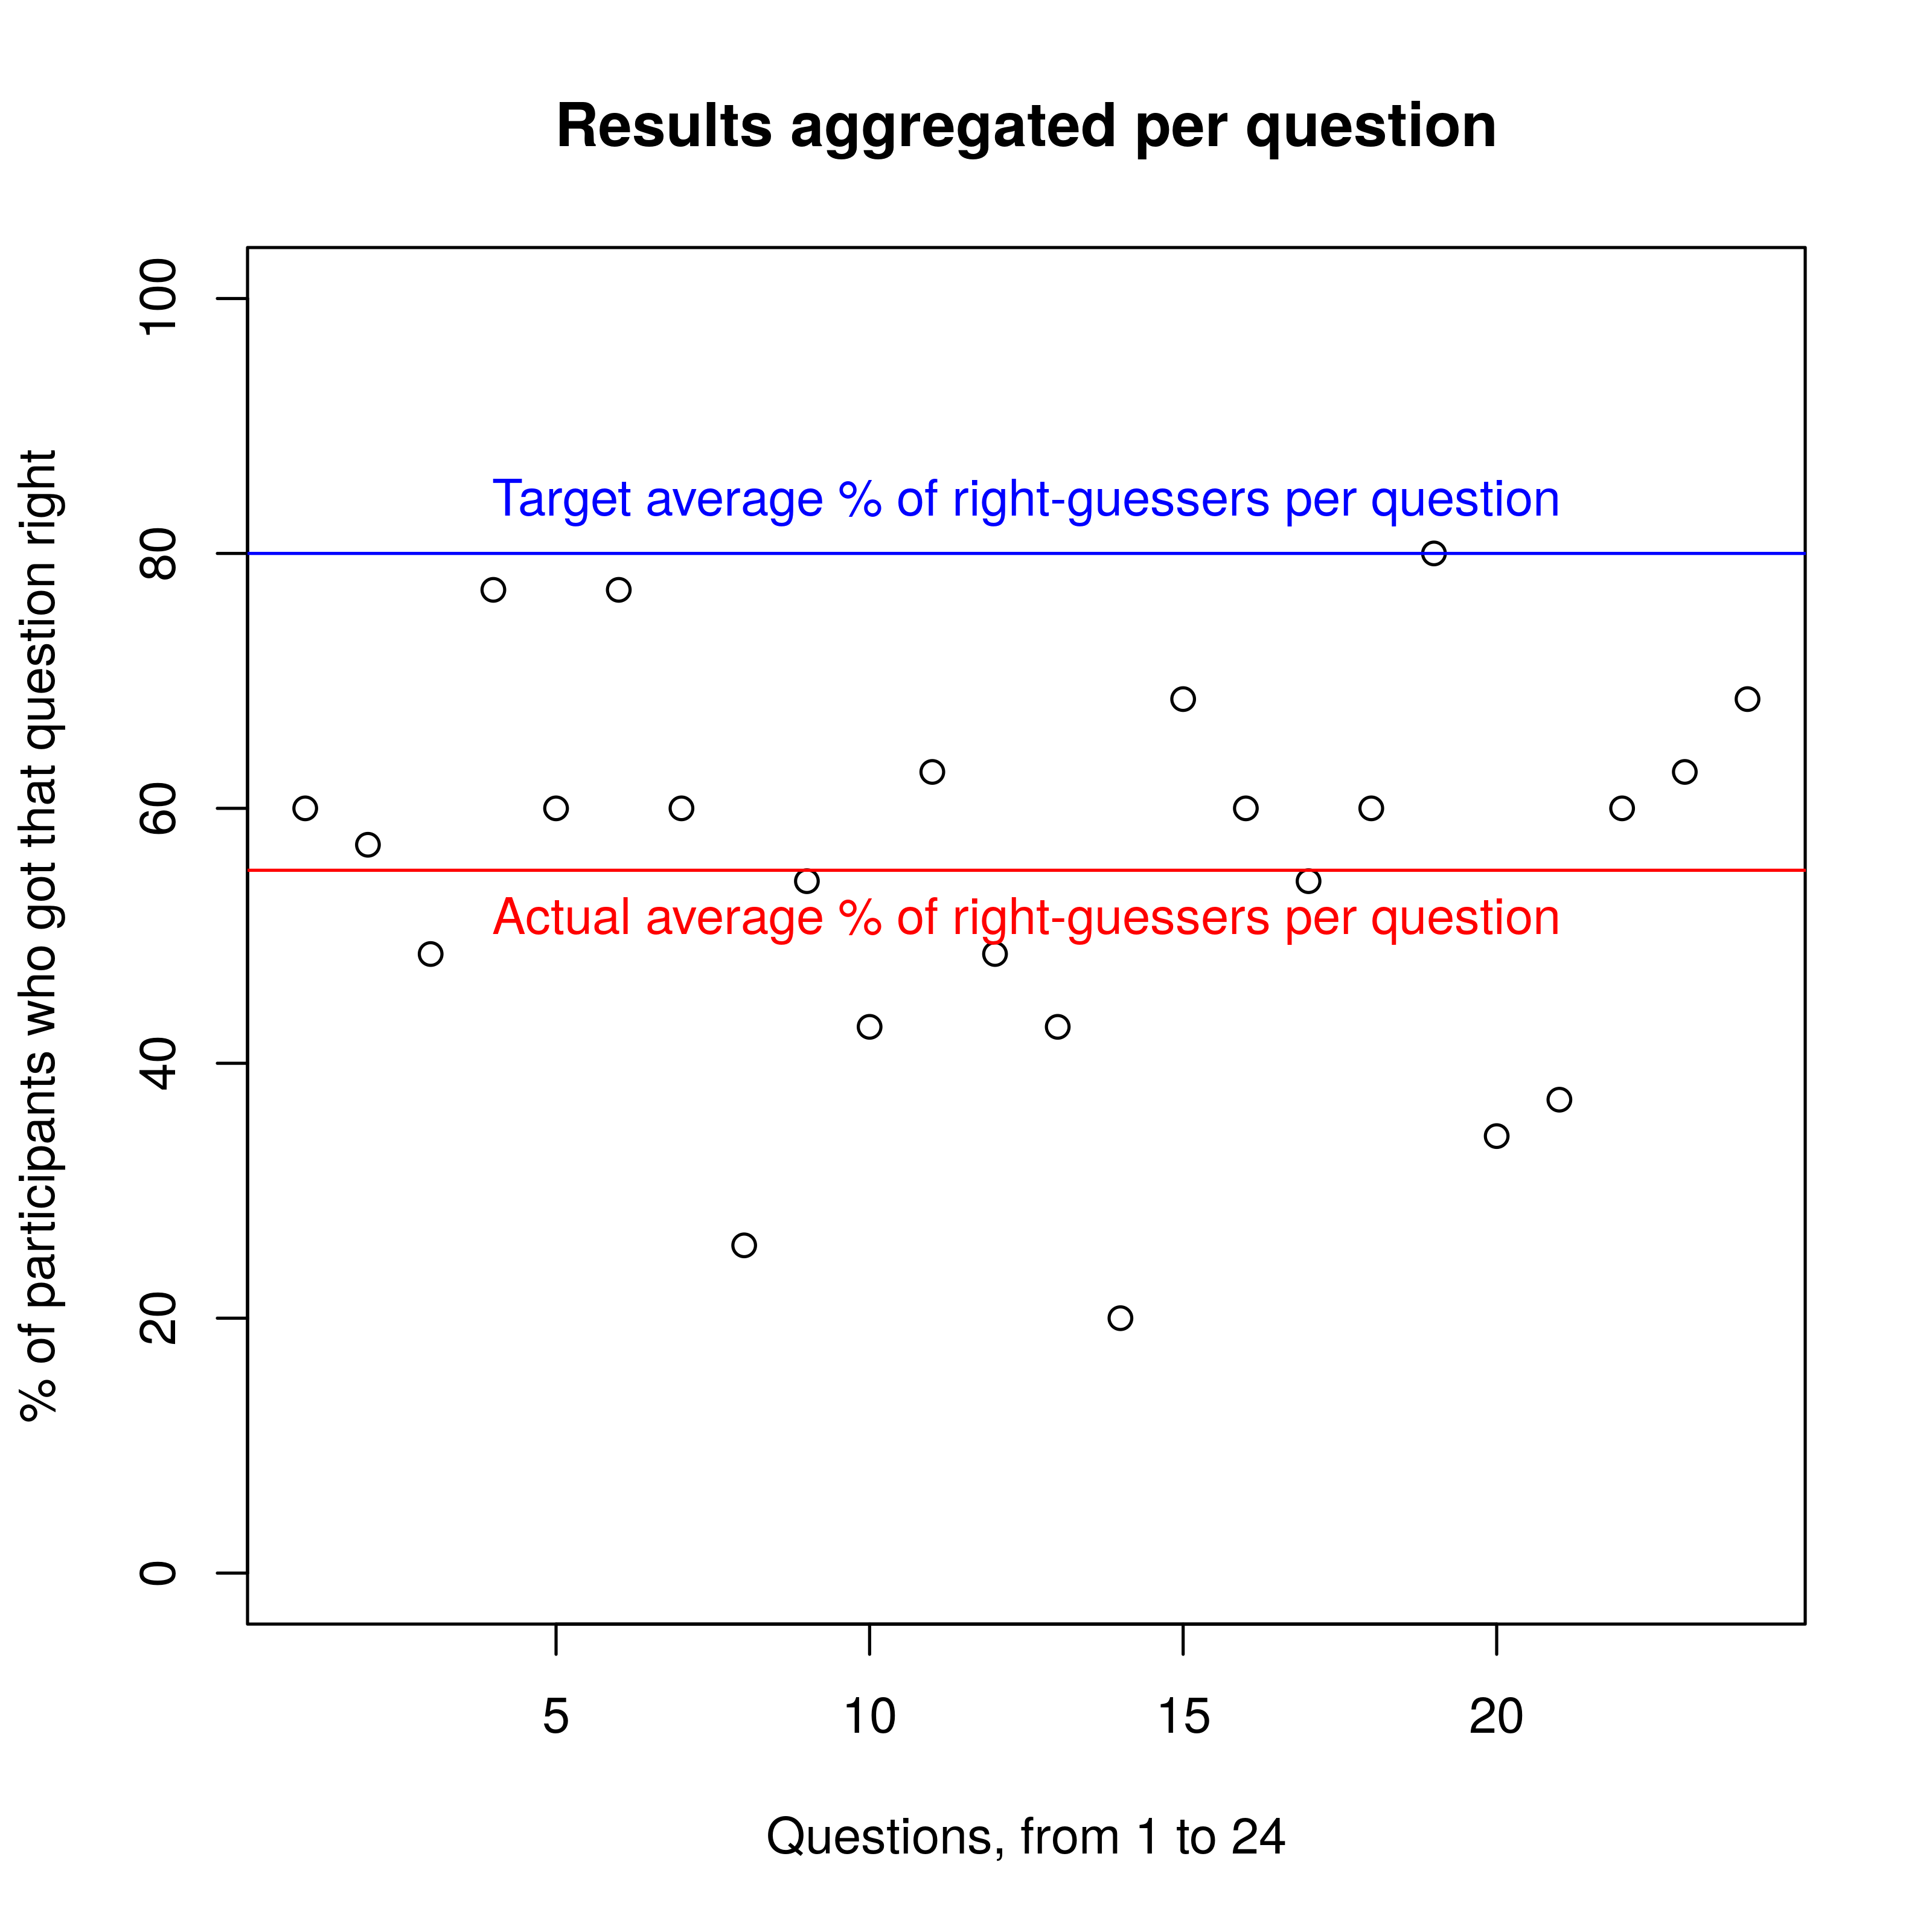
Is this an spurious result because a small number of questions were really, really hard?
No. See the following scatterplot:
Further analysis
Questions for further analysis:
- Should the two savants who got very near 80% be proud, or should we expect them to exist merely by chance?
- Are the results an artifact of a small number of questions which were really hard (f.ex. the % of LessWrongers in EA)? Answered: No, See above.
Code.
You can find Predictions.csv and answers.csv by following the links.
> ### We first read the data
> DataFrame <- read.csv(file="Predictions.csv", header=TRUE, sep=",")
> View(D)
>
> ### We then create a different object for storing the cleaned up data
> DataFrameProcessed=data.frame(matrix(nrow=35,ncol=52))
> LowerBoundsPersoni=NULL
>
> ### And clean up the data.
> for(i in c(1:35)){
+ as.numeric(strsplit(as.character(DataFrame[i,5]),", ")[[1]]) -> LowerBoundsPersoni
+ as.numeric(strsplit(as.character(DataFrame[i,6]),", ")[[1]]) -> UpperBoundsPersoni
>
+ for(j in c(1:26)){
+ DataFrameProcessed[i,(j*2)-1] <- LowerBoundsPersoni[j]
+ DataFrameProcessed[i,(j*2)] <- UpperBoundsPersoni[j]
+ }
+ }
> ### It shows that I've been programming in C.
>
> c(paste("Person-",c(1:35),sep=""))->rownames(DataFrameProcessed)
> c(rbind(paste("Q",c(1:26),"-lower",sep=""),paste("Q",c(1:26),"-upper",sep="")))->colnames(DataFrameProcessed)
> View(DataFrameProcessed)
>
> answers <- read.csv(file="answers.csv", header=TRUE, sep=",")[,2]
>
> ### Although every person answered every question, 2 anwers are not available.
> replaceNA <-function(x,y){
+ return( ifelse(is.na(x), y, x) )
+ }
>
> sum2<-function(x){ return(sum(replaceNA(x))) }
>
> ### Because some of the answers are not available, the comparison will give a NA. So we need sum2.
> total <- function(x){
+ y=c(1:26)*2
+ return(sum2(as.vector((answers>=DataFrameProcessed[x,y-1])) & as.vector(answers<=DataFrameProcessed[x,y])) )
+ }
>
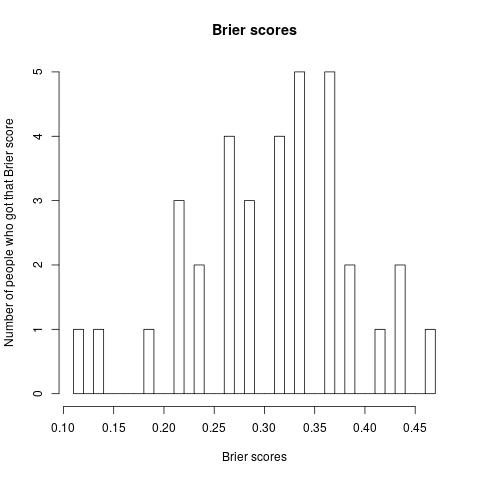
> ### We can get the Brier scores:
> Brierscore <- function(x){ return( (x*(1-0.8)^2 + (24-x)*(.8)^2)/24) }
>
> ### vapply applies a function to every member of a vector.
> vapply(c(1:35),total,numeric(1))->DataFrameProcessed$totalcorrect
> vapply(DataFrameProcessed$totalcorrect,Brierscore,numeric(1))->DataFrameProcessed$Brierscores
>
> ### We can also aggregate stuff by question:
> totalperquestion <-function(x){
+ z=c(1:35)
+ return(sum2(as.vector((answers[x]>=DataFrameProcessed[z,2*x-1])) & as.vector(answers[x]<=DataFrameProcessed[z,2*x])) )
+ }
> vapply(c(1:26), totalperquestion, numeric(1)) -> TotalCorrect
> percentageperquestion <-function(x){return( totalperquestion(x)*100/35)}
> png("Scatterplot-questions.png", units="px", width=3200, height=3200, res=500)
>
> ### And you can get graphics using
> png("Scatterplot3.png", units="px", width=3200, height=3200, res=500)
> plot(DataFrameProcessed$totalcorrect*100/24, xlab= "Persons, from 1 to 35", ylab="% of questions they got right", main="Scatterplot!")
> abline(h=mean(DataFrameProcessed$totalcorrect)*100/24, col="red")
> abline(h=80, col="blue")
> text(x=20, y=56, col="red", "Actual average")
> text(x=20, y=81, col="blue", "Target average")
> dev.off()
> ### As well as with the function hist(), whose parameter break = number allows you to control the granularity of the histogram.
> png("Scatterplot-questions.png", units="px", width=3200, height=3200, res=500)
> plot(vapply(p, percentageperquestion, numeric(1)), ylim=c(0,100), main="Results aggregated per question", xlab="Questions, from 1 to 24", ylab= "% of participants who got that question right")
> abline(h=80, col="blue")
> abline(h=55.14286, col="red")
> text(x=12.5, y=80+4, "Target average % of right-guessers per question", col="blue")
> text(x=12.5, y=55.14286-4, "Actual average % of right-guessers per question", col="red")
> dev.off()