11 KiB
Discontinuous Progress in technological trends.
AI Impacts has a list of promising research projects. One of them reads as follows:
Look for technologies that may have caused discontinuous progress on any metric. Find data for that metric over the relevant time, and measure the size of any discontinuity in terms of how many years of progress at usual rates happened at once. We have a list of technologies which others purport were discontinuous, to check. A particularly important one is recent Go AI as a discontinuity in Elo rating achievable, adjusted for hardware.
This is an input to our ongoing investigation into how frequently, and when, technological trends undergo discontinuous progress. This should inform our guesses about how likely AI development is to see discontinuous progress, both by providing a base rate, and telling us whether AI technologies seem especially susceptible. We take discontinuous progress in AI to be related to risk of fast takeoff.
Discontinuity from the SS Great Eastern
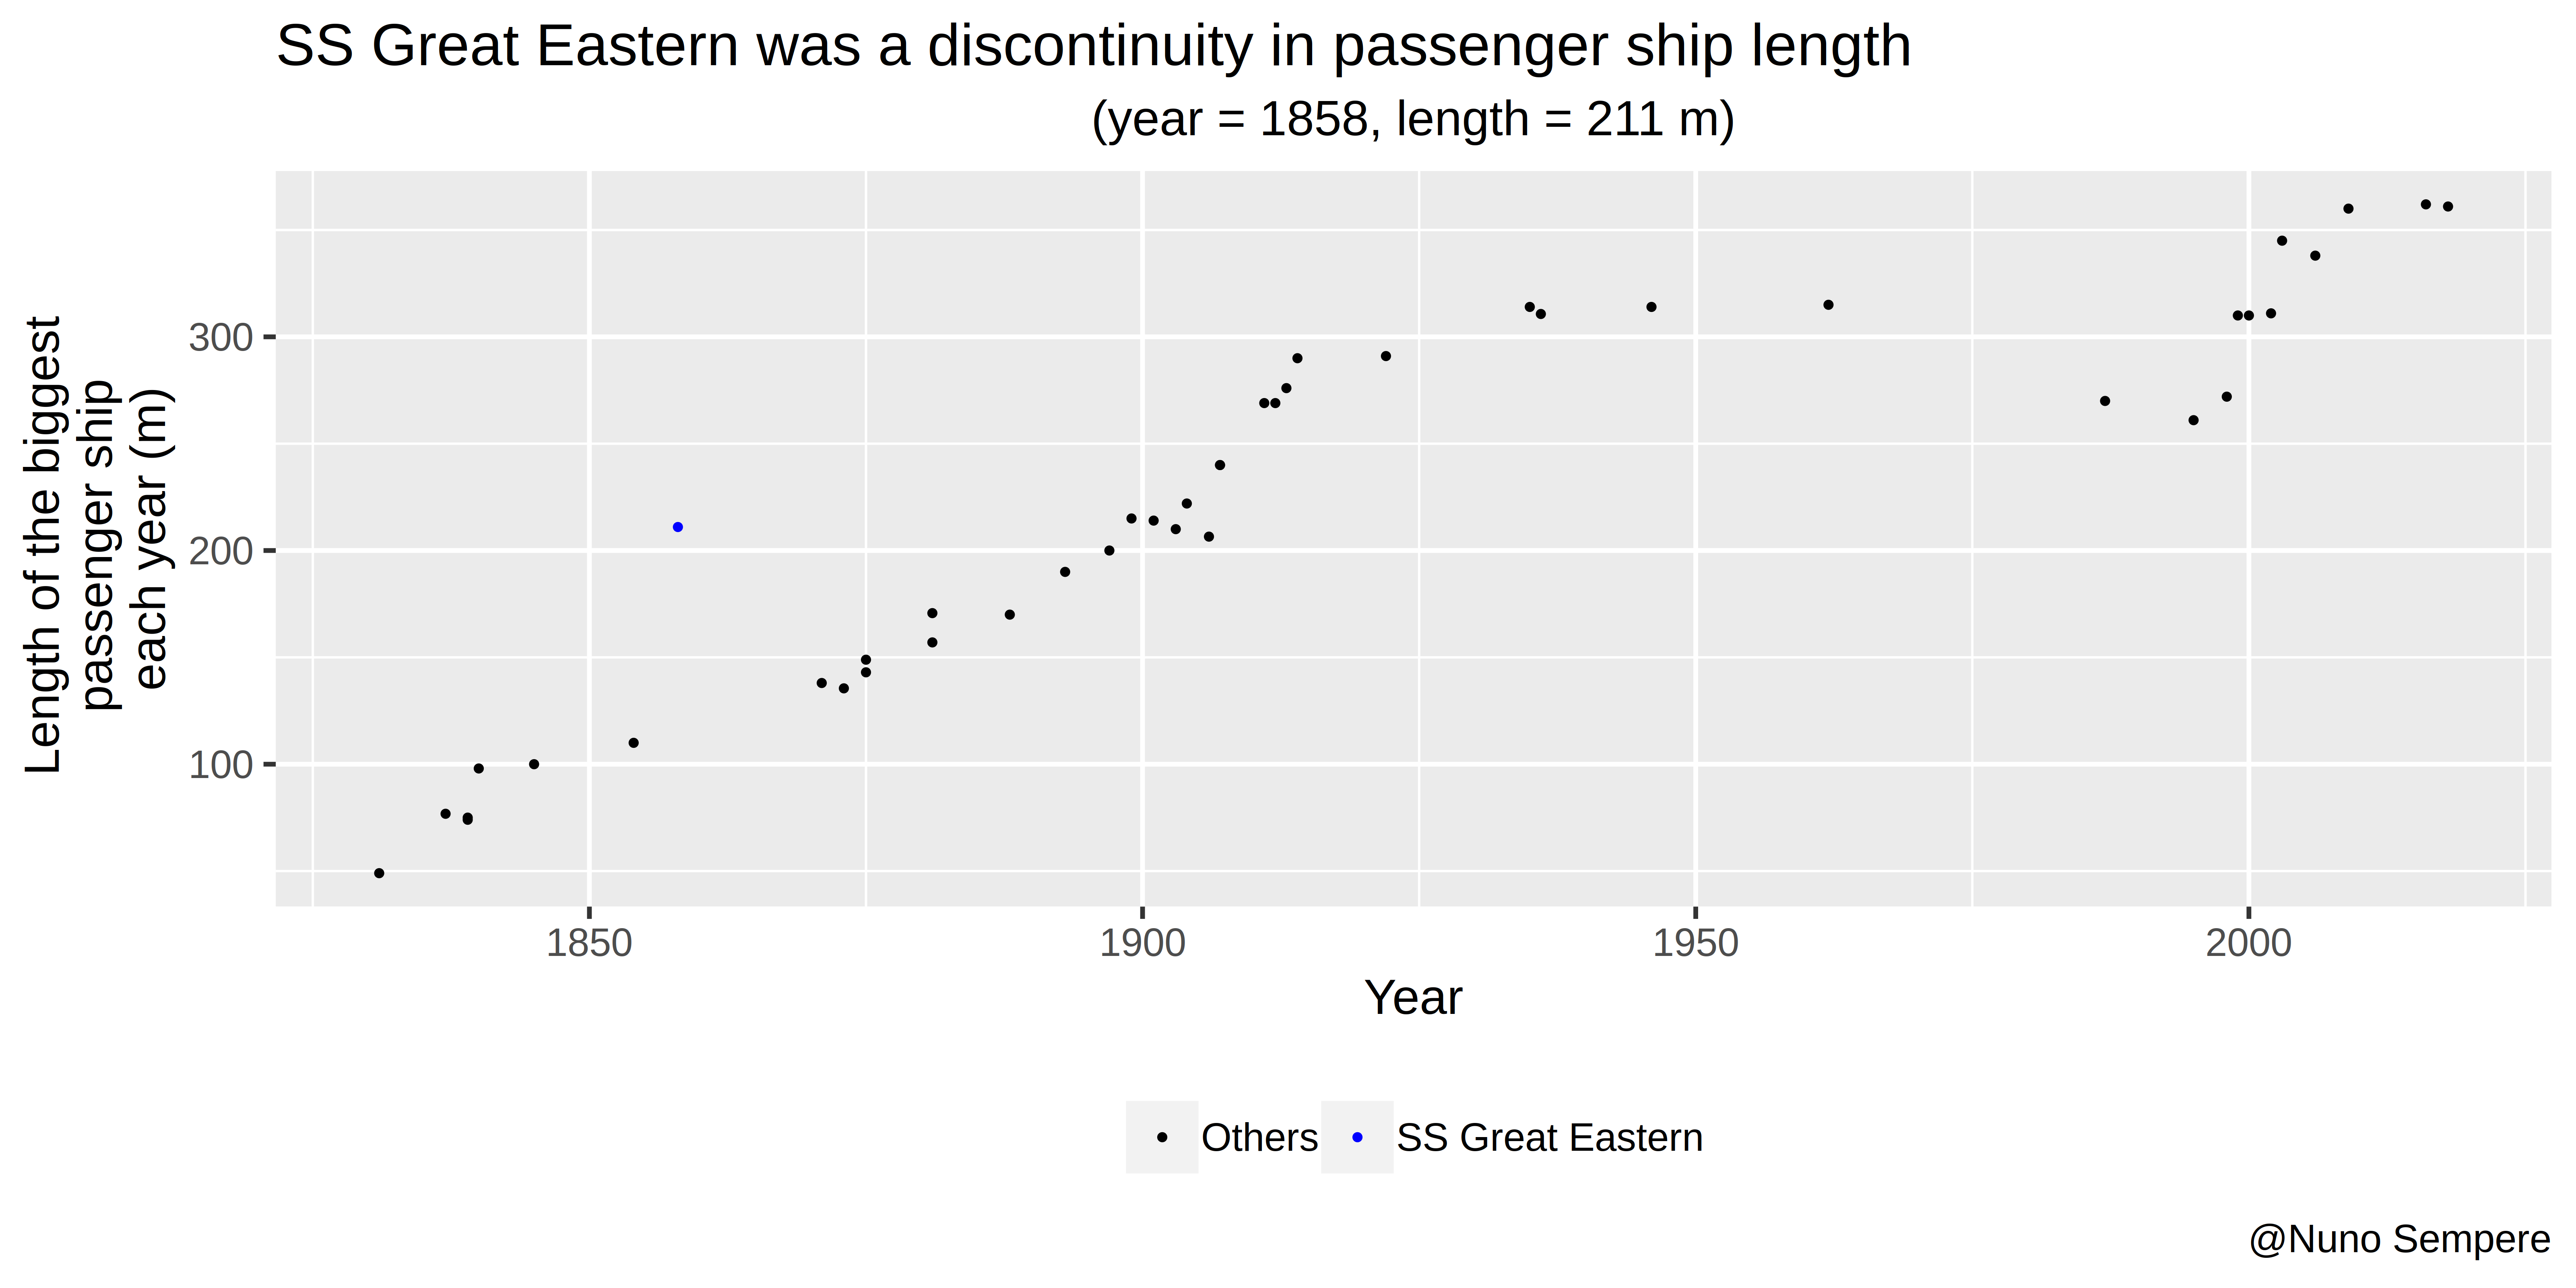
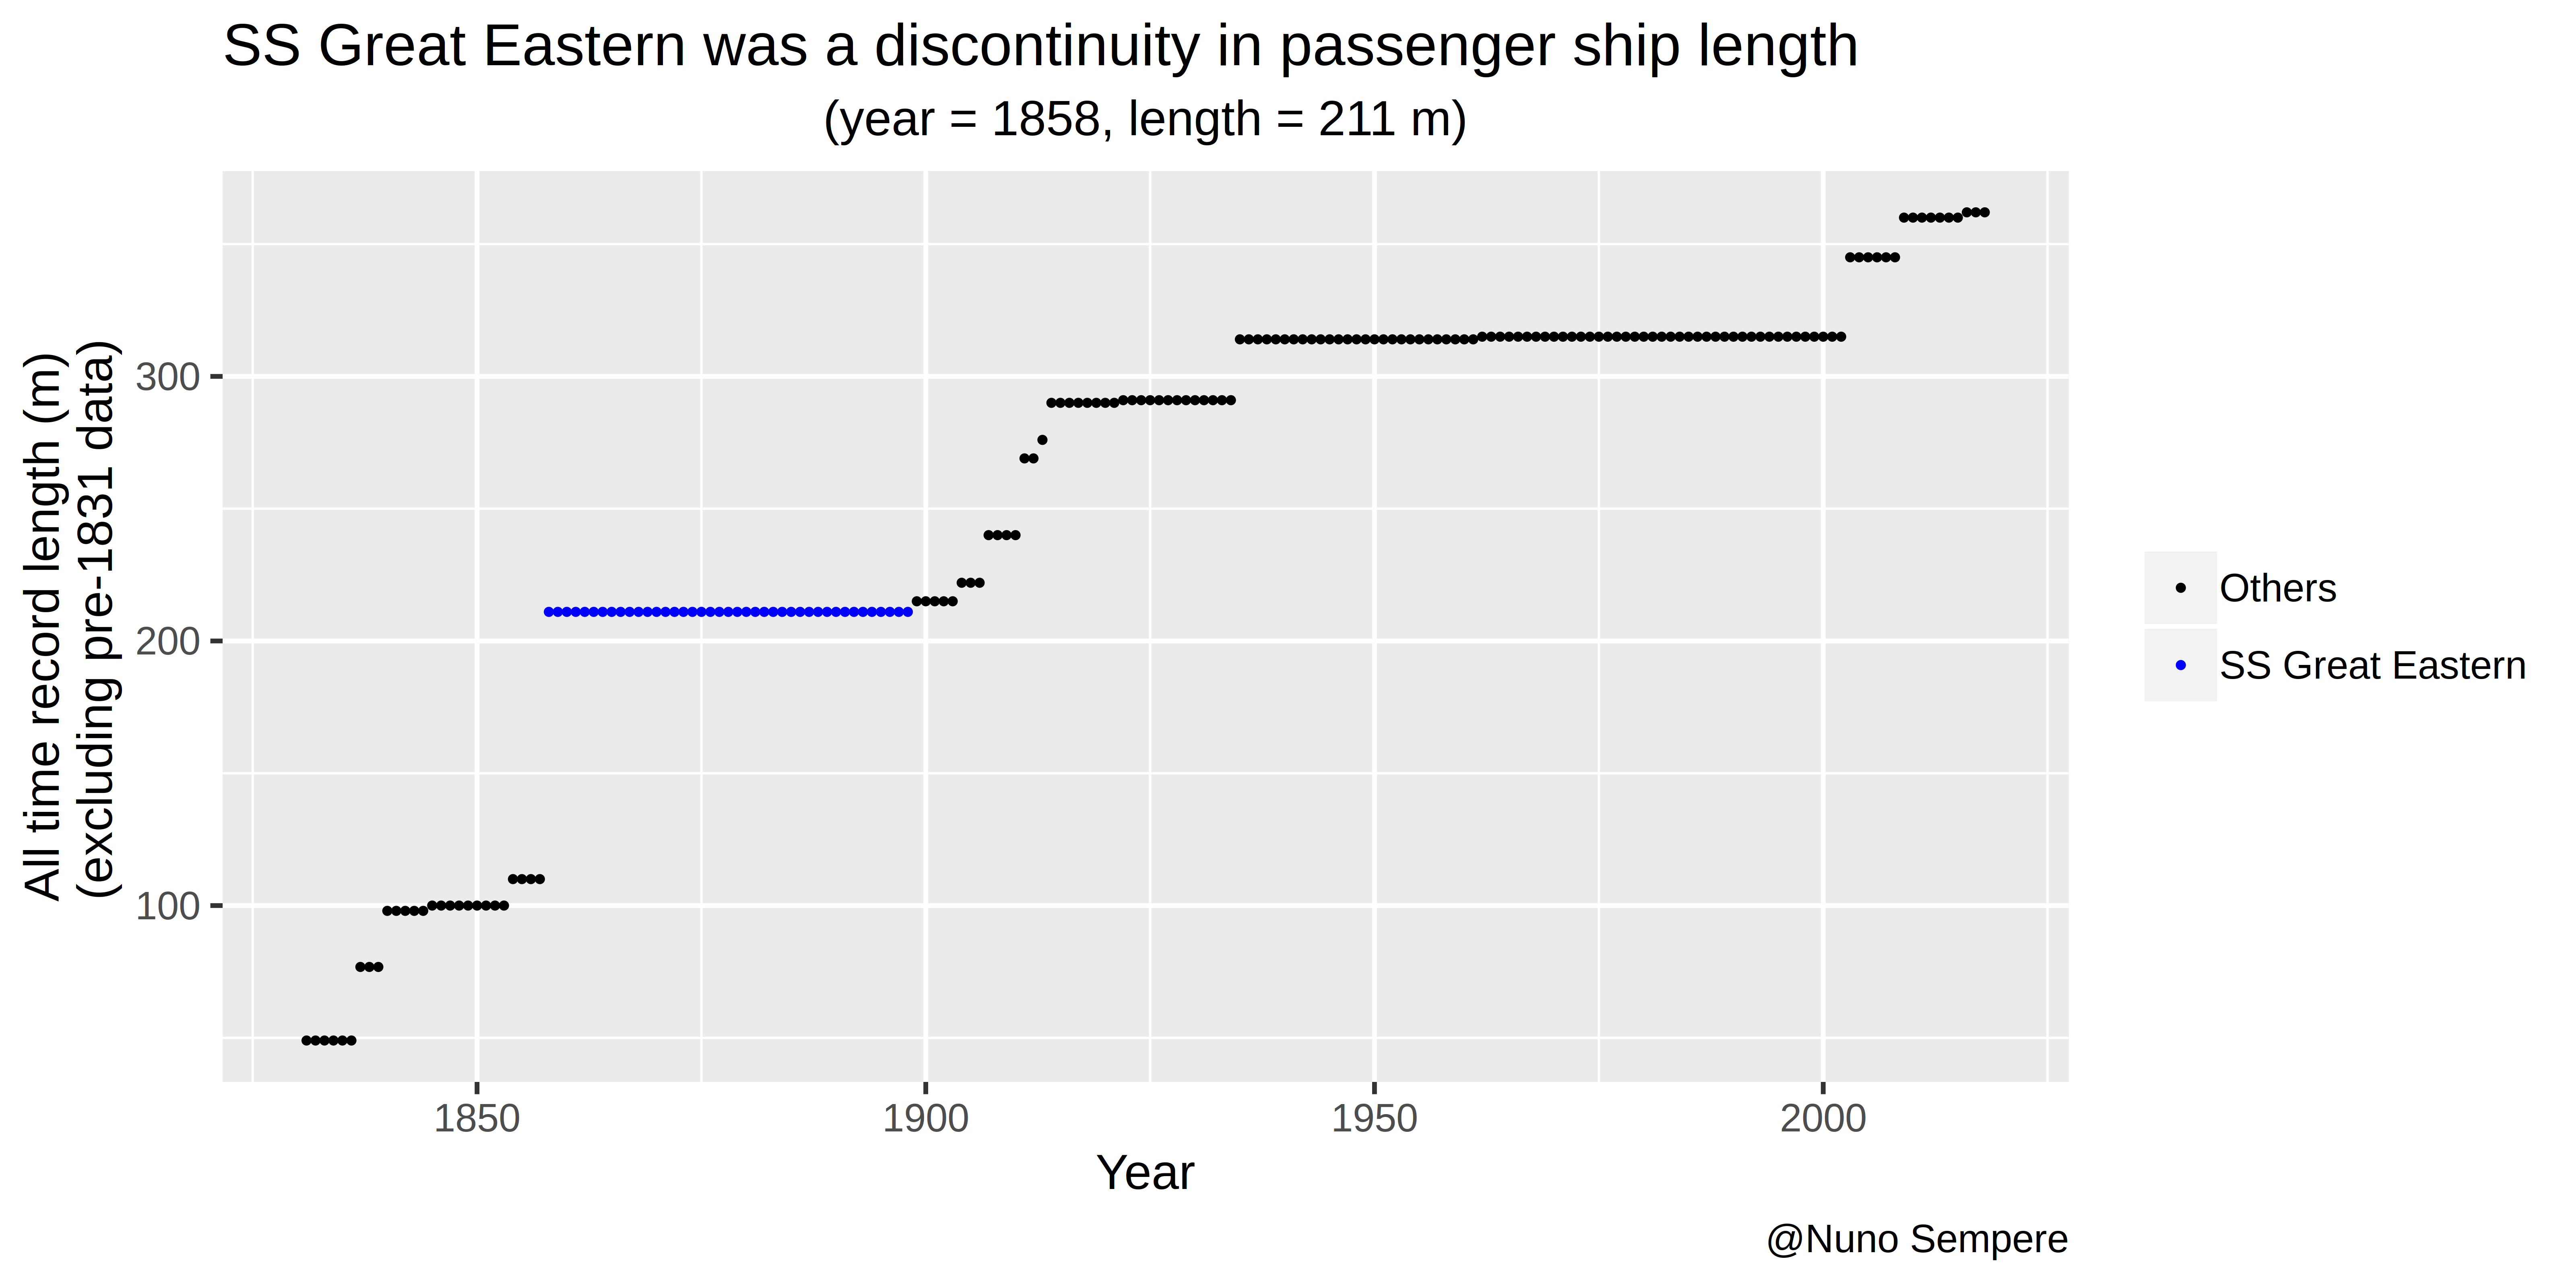
At the point of transition between wooden and metal ships, the engineer Isambard Kingdom Brunel skipped ahead and built an ambitious ship which, with a length of 211 meters, wasn't quite twice as big as the ones preceding it, the SSC Great Eastern. It represented a discontinuity of about 40 years. Afterwards, competition between liner companies (and later cruises) kept a discontinuity from arising, though ship size kept increasing.
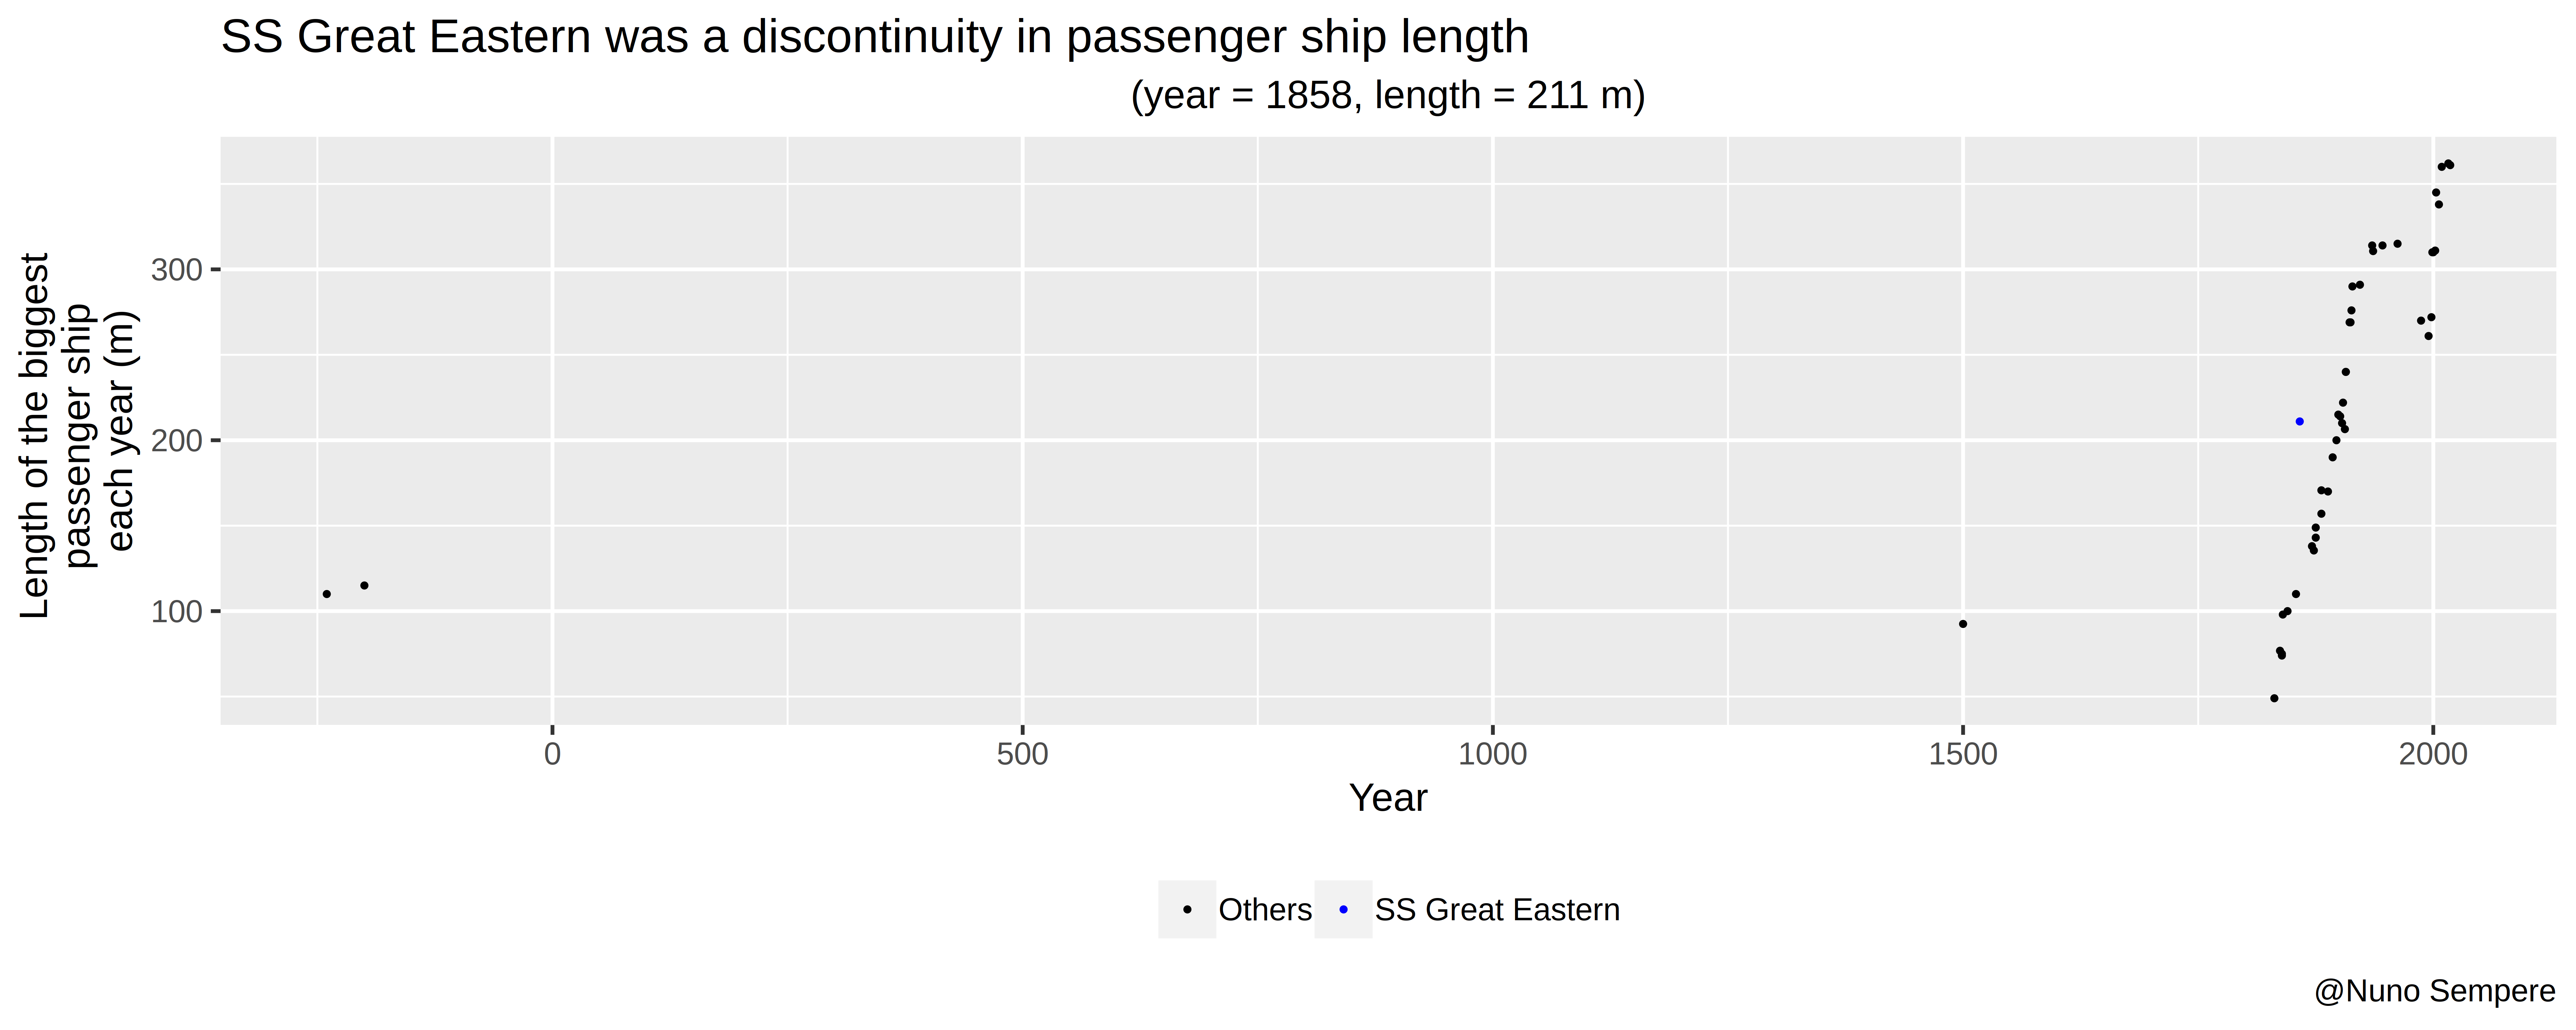
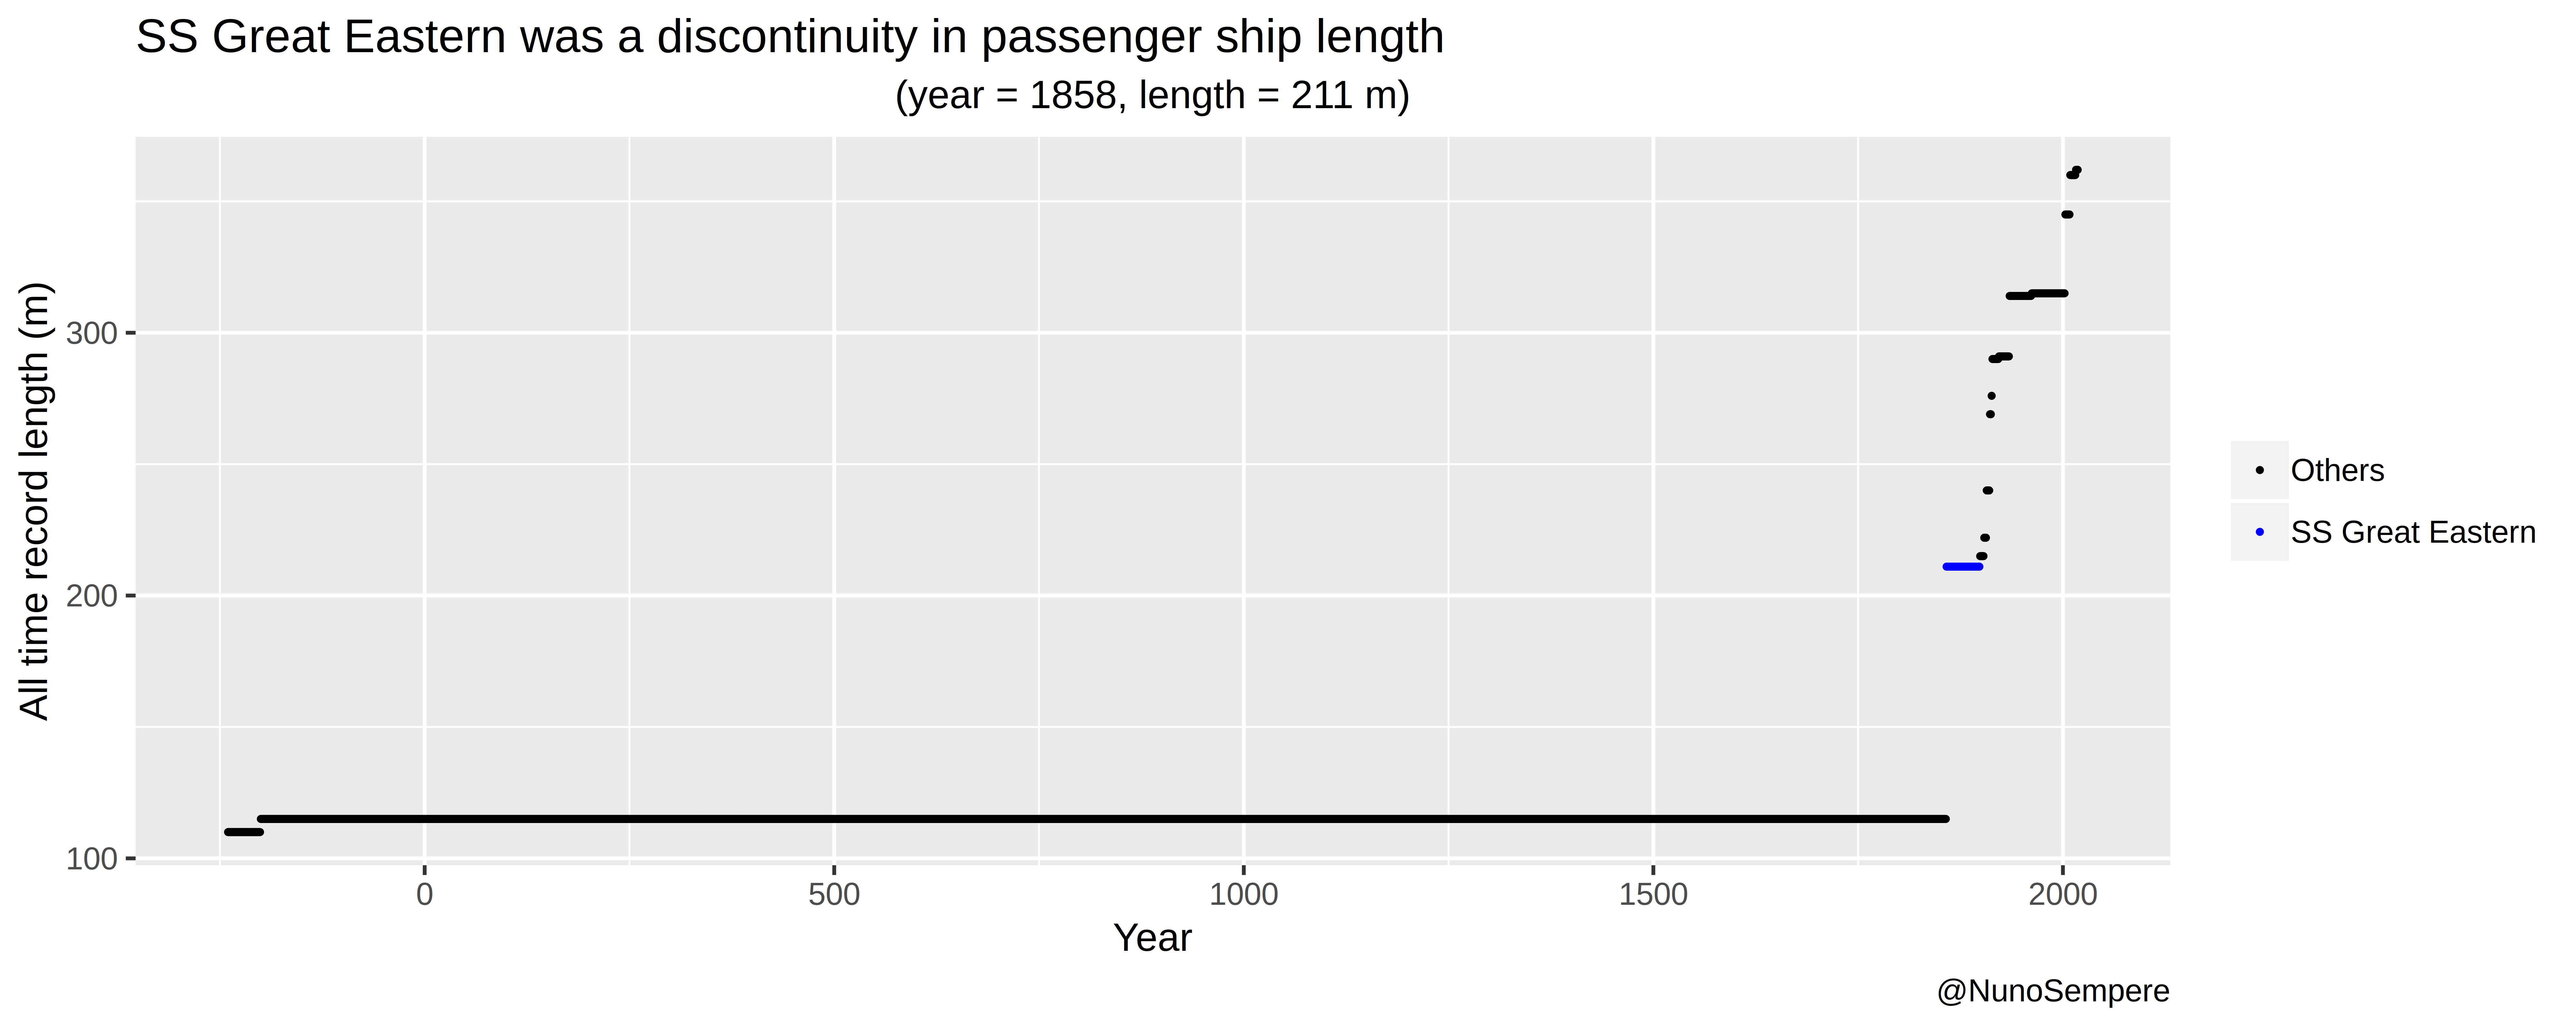
Two difficulties arise: Firstly, the most convenient data only includes passenger ships. However, the categories "biggest ship" and "biggest passenger ship" were often synonymous in the period of interest: passenger ships were routinely the biggest ships at least until WW1 (SS President, the SS British Queen, SS Great Eastern, the RMS Celtic, RMS Baltic, the RMS Titanic, etc). Nonetheless, at some point afterwards, other categories of ship, i.e., oil tankers become the biggest ships overall. Secondly, the sizes of the ships of antiquity are not well recorded. For this reason, I just consider data for European ships, starting in the 19th century, and exclude f.ex., Chinese, Greek and Javanese naval history. I feel that this makes sense, because the Thalamegos's size of 115 meters (200 BCE) just wasn't surpassed by anything in Europe until the SS Great Eastern itself, although perhaps it was by poorly documented Chinese and Javanese vessels.
Here follow four images which make the discontinuity apparent. In the later two, the already mentioned Thalamegos and the Syracusia (designed by Archimedes) are given as reference points.
Sources:
Wikipedia: List of longuest wooden ships
Timeline of largest passenger ships
Wikipedia: List of longuest ships
Big Ships in History, 1913, R.C. Anderson.
Data
Wikipedia: Timeline of largest passenger ships, as a .csv file
Discontinuity in the circumnavigation of the Earth
We find 4 discontinuities:
- From the first two explorers to later followers. Year = 1586. Estimated discontinuity equivalent to 203 / 240 years of previous progress.
- From big expeditions to liners and trains. Year 1870. Estimated discontinuity equivalent to 740 / 1986 years of equivalent progress.
- From ships to aircraft. Year 1931. Estimated discontinuity equivalent to 11 / 40.5 years
- From military aircraft to the first cosmonaut, Yuri Gagarin. Year 1961. Estimated discontinuity equivalent to 1 / 27.5 years.
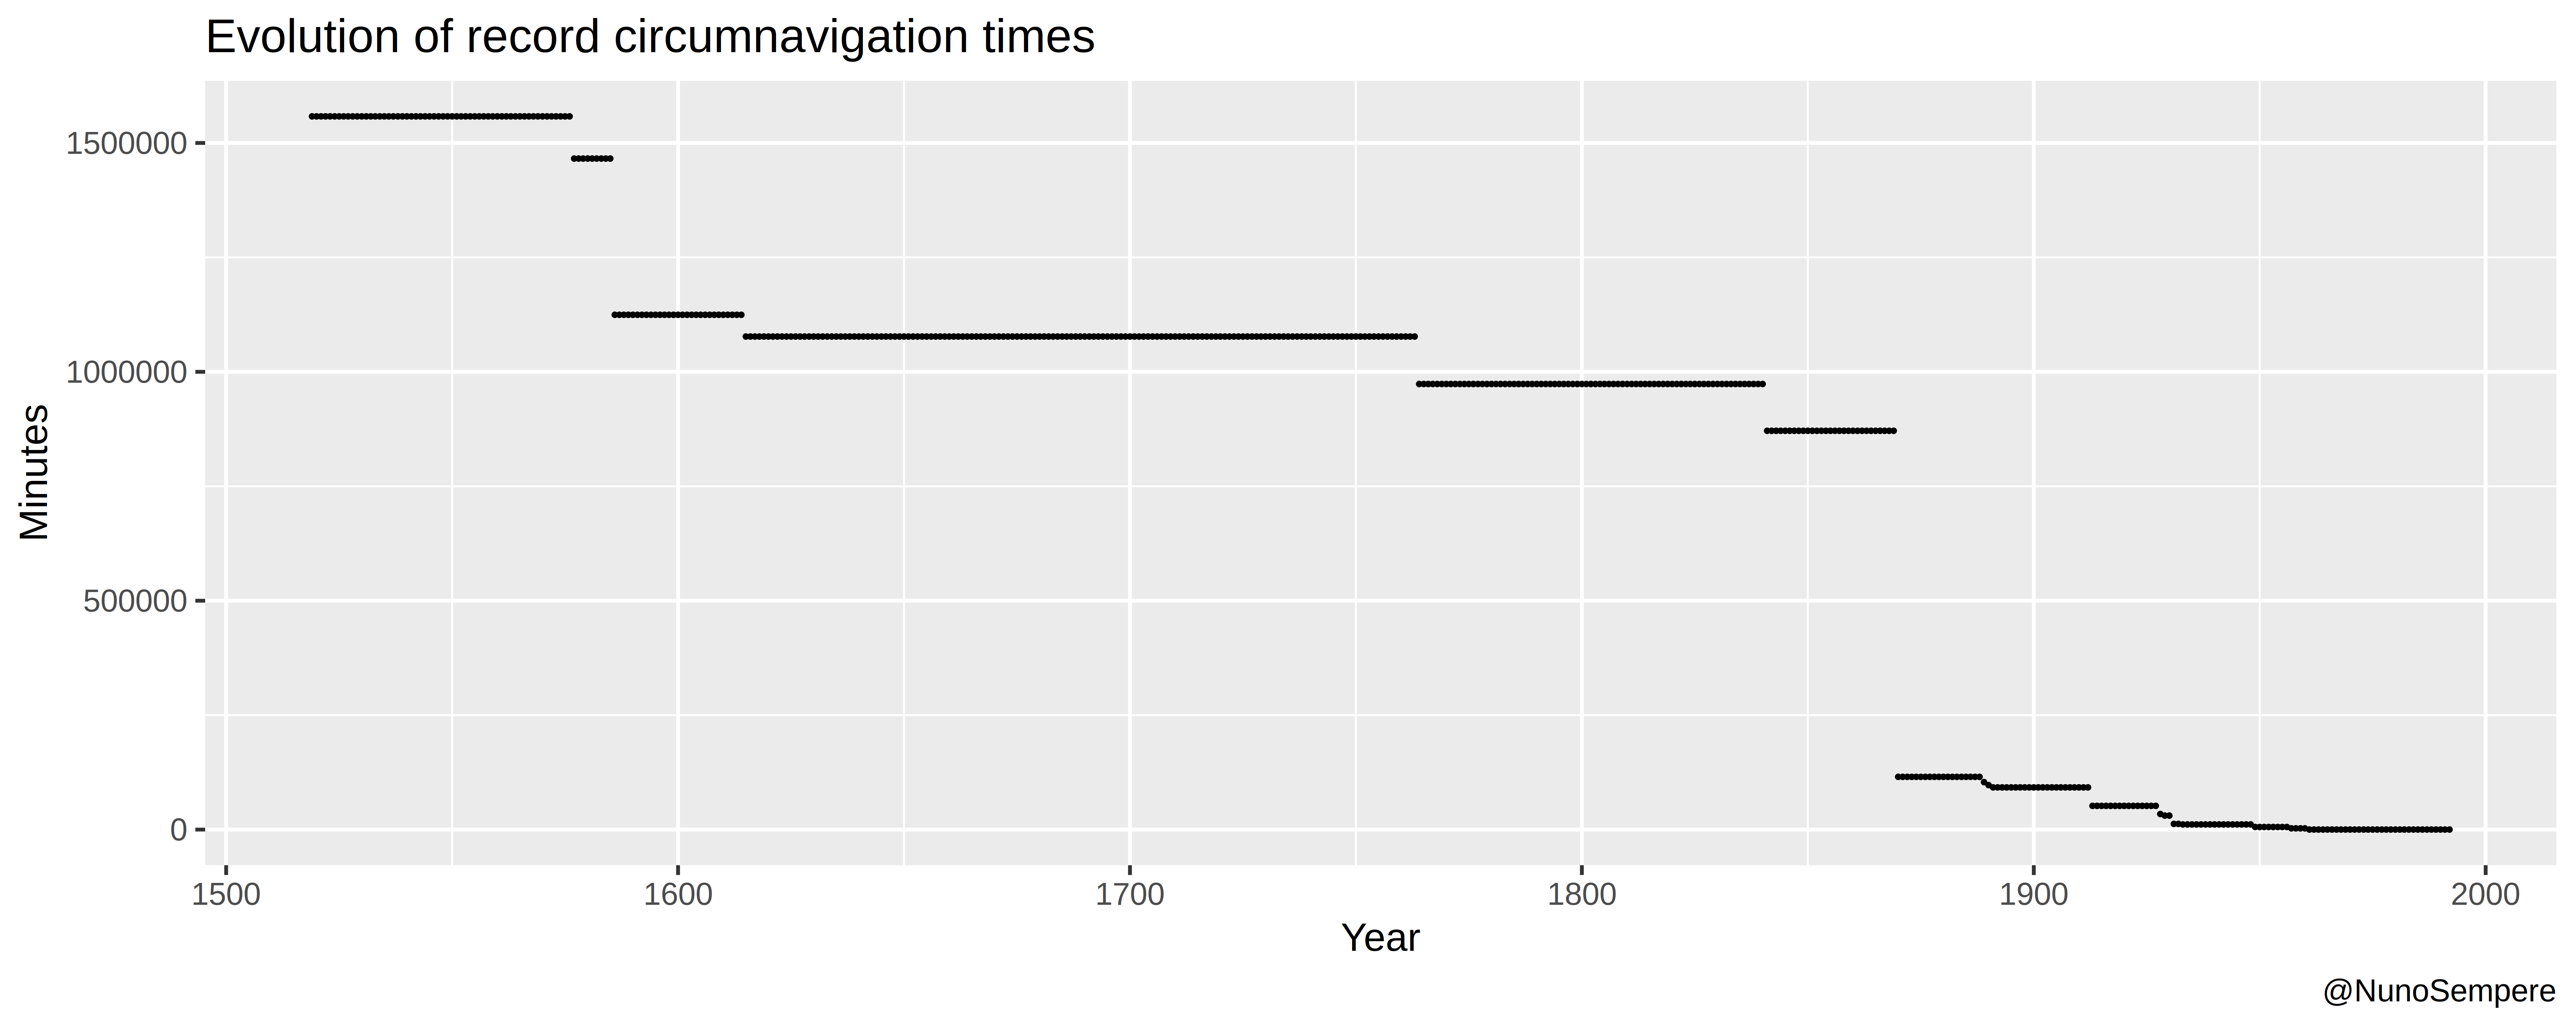
The precise magnitude of these discontinuities depends on whether we measure time, or its logarithm. In both cases, we get very large discontinuities, plausibly of more than 100 years. However, our estimates are inexact. In particular, our data only shines in the period 1870 - 1949, and thus we are most confident in the discontinuity created by the first circumnavigation by plane (as opposed to by ship & train). This happened in 1931 and our two estimates of its magnitude are 11 and 40.5 years.
If we plot the overall time record, in minutes, we can appreciate the first two discontinuities.
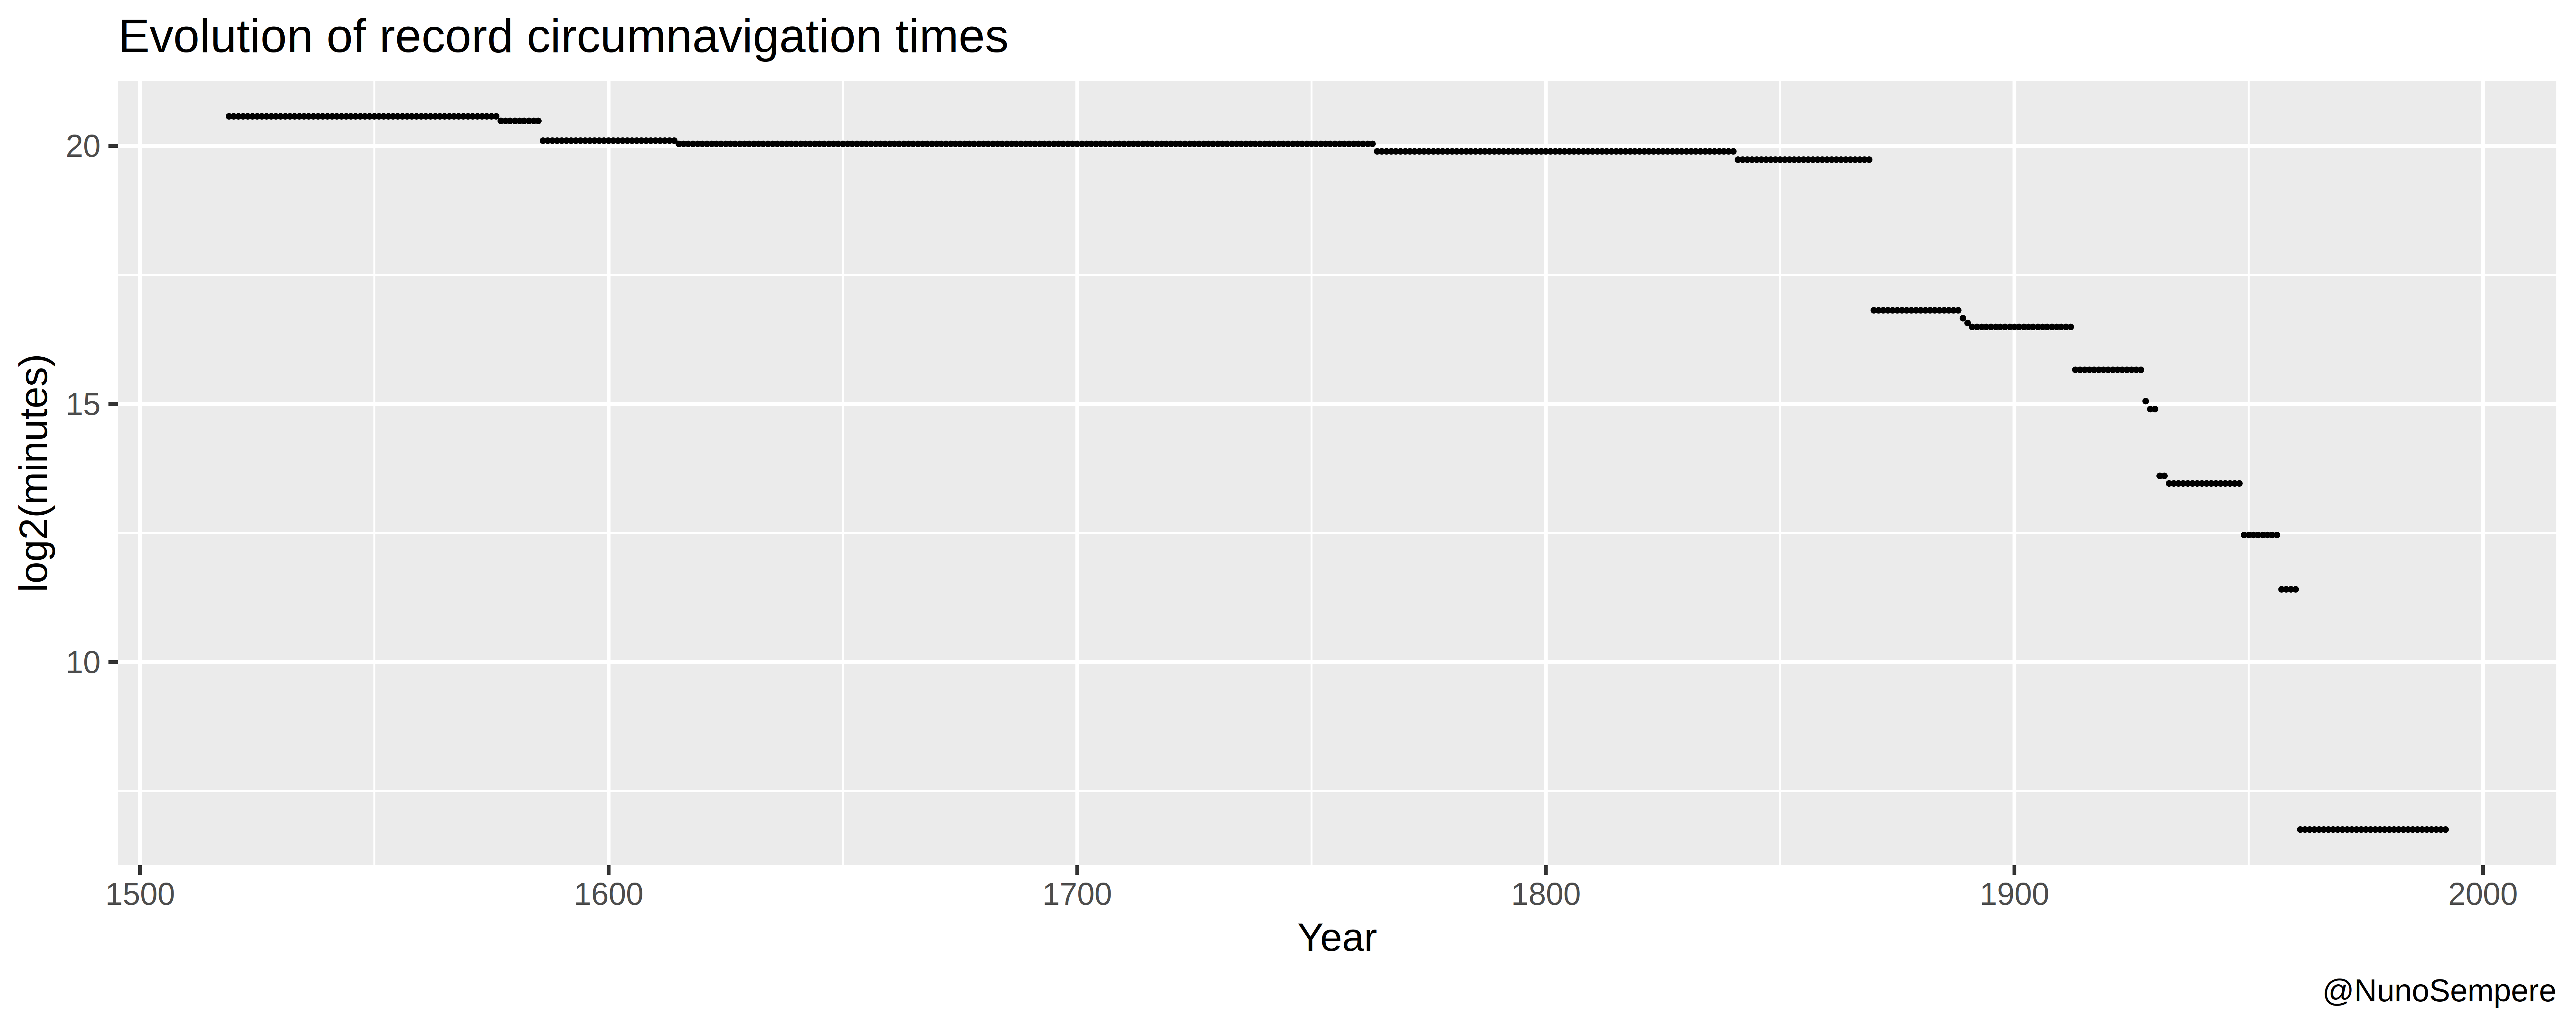
They become apparent if we plot the logarithm (base 2) of the time (in minutes).
Here is furthermore a table:
| Year | Rate of progress before | Discontinuity in terms of time of travel = New record - current record | How much extra time would have been needed? = (point - previous predicted point)/ previous rate of progress = (discontinuity - expected progress) / previous rate of progress |
|---|---|---|---|
| 1586 | (1082-1018) days /(1577-1519) years = 1.1034 days/year | 1018-781 = 237 days | (237 days - (1589-1577)*1.1 days) / 1.1 days / year= 203 years |
| 1870 | (781 – 605) days / (1841 – 1586) years = 0.69 days/year | 605-80 days = 525 days | (525 days - (1870-1849 years)*0.69 days / year ) / 0.69 days/year = 740 years |
| 1931 | (80-21) days / (1929-1870) years = 1 day / year | 21-8 days = 13 days | (13 days - (1931 - 1929) years * 1 day/year) / 1 day/year = 11 years |
| 1957 | (94 - 45) hours / (1957- 1949) years = 6.1 hours / year | 32 hours and 49 minutes - 108 minutes = 31 hours | ( 31 hours - 6.1 hours/year *(1961-1957) years ) / 6.1 hours / year ~ 1 year |
And here is that same table if we measure progress according to the logarithm (i.e., if halving the time needed is always equally impressive).
| Year | Rate of progress before (where log = log of base 2) | Discontinuity in terms of time of travel = New record - current record | How much extra time would have been needed? = (point - previous predicted point)/ previous rate of progress = (discontinuity - expected progress) / previous rate of progress |
|---|---|---|---|
| 1586 | (log2(1082)-log2(1018)) log2(days) /(1577-1519) years = 0.001444656 log2(days)/year | log2(1018)-log2(781) = 0.3823431 log2(days) | (0.3823431 log2(days) - (1589-1577)*0.001516602 log2(days)) / 0.08796 log2(days)/year= 240 years |
| 1870 | (log2(781) – log2(605)) days / (1841 – 1586) years = 0.001444656 log2(days)/year | log2(605)-log2(80) days = 2.9 log(days) | (2.9 log(days) - (1870-1849 years)*0.001444656 log2(days)/year ) / 0.001444656 log2(days)/year = 1986 years |
| 1931 | (log2(80)-log2(21)) days / (1929-1870) years = 0.03270527 log2(days)/year | log2(21)-log2(8) days = 1.39 log2(days) | (1.392317 log(days) - (1931 - 1929) years * 0.03270527 log(days)/year / 0.03270527 log2(days)/year = 40.5 years |
| 1957 | (log2(94) - log2(45)log2(hours) / (1957- 1949) years = 0.132842 log2(hours) / year | log2(32 hours and 49 minutes) - log2(108 minutes) = 4.18836 log2(hours) | ( 4.18836 log2(hours) - 0.132842 log2(hours) / year *(1961-1957) years ) / 27.52888 log2(hours) / year ~ 27.5 years |
It's interesting to see that according to the first measure, the first cosmonaut wasn't really a discontinuity (a deviation of 1 year from the predicted value). After Gagarin, one might think that it's not possible to reduce the time any further. Note, however, that sending a digital copy of a human through the internet might count. Also note that your definitions get in the way.
It's also interesting to consider that today, a packet might take less than half a second to circumnavigate the Earth (perhaps 180-400 miliseconds, according to a source from 2010). Another discontinuity to investigate might be the time needed to send a message through the Atlantic.
Sources:
Wikipedia: List of circumnavigations
Wikipedia: Circumnavigation record progression
Data
Wikipedia: List of circumnavigations (until Yuri Gagarin)
Fastest circumnavigation, year by year
Also considered / under consideration:
- Saline solution for diarrhea, as opposed to previous treatments.
- Time to send a message across the atlantic.
- Discontinuities for yatch races (A quick glance does not reveal any discontinuities. I do not intend to research this further)
- Transatlantic sailing record (A quick glance does not reveal any discontinuities. I do not intend to research this further)
Credit
The SS Great Eastern was brought to my attention in the "Bountied Rationality" Facebook group.