| .. | ||
| components | ||
| data | ||
| lib | ||
| pages | ||
| public | ||
| styles | ||
| LICENSE.txt | ||
| netlify.toml | ||
| package.json | ||
| postcss.config.js | ||
| README.md | ||
| tailwind.config.js | ||
| yarn.lock | ||
About
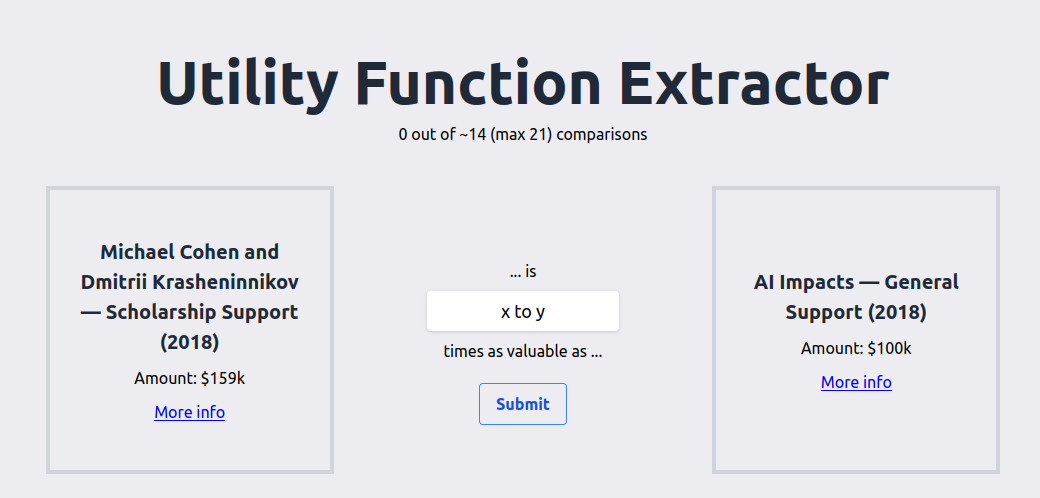
This repository creates a react webpage that allows to extract a utility function from possibly inconsistent binary comparisons.
It presents the users with a series of elements to compare, using merge-sort in the background to cleverly minimize the number of choices needed.
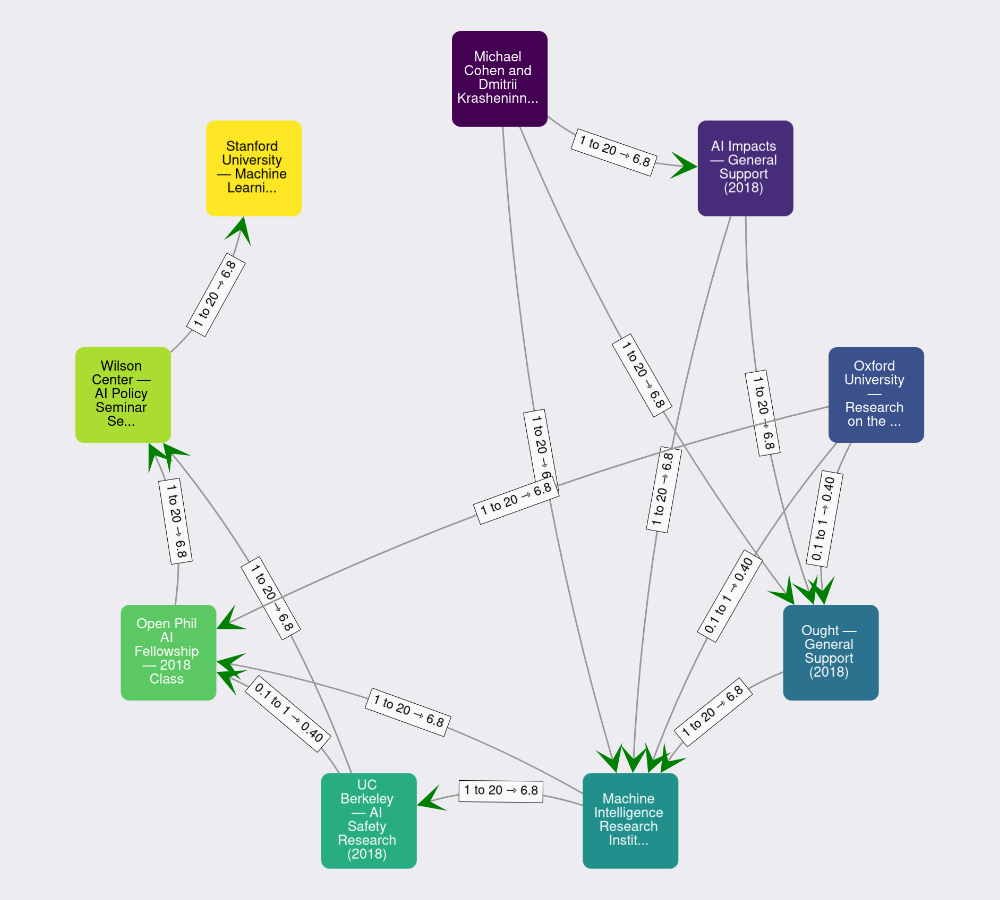
Then, it cleverly aggregates them, on the one hand by producing a graphical representation:
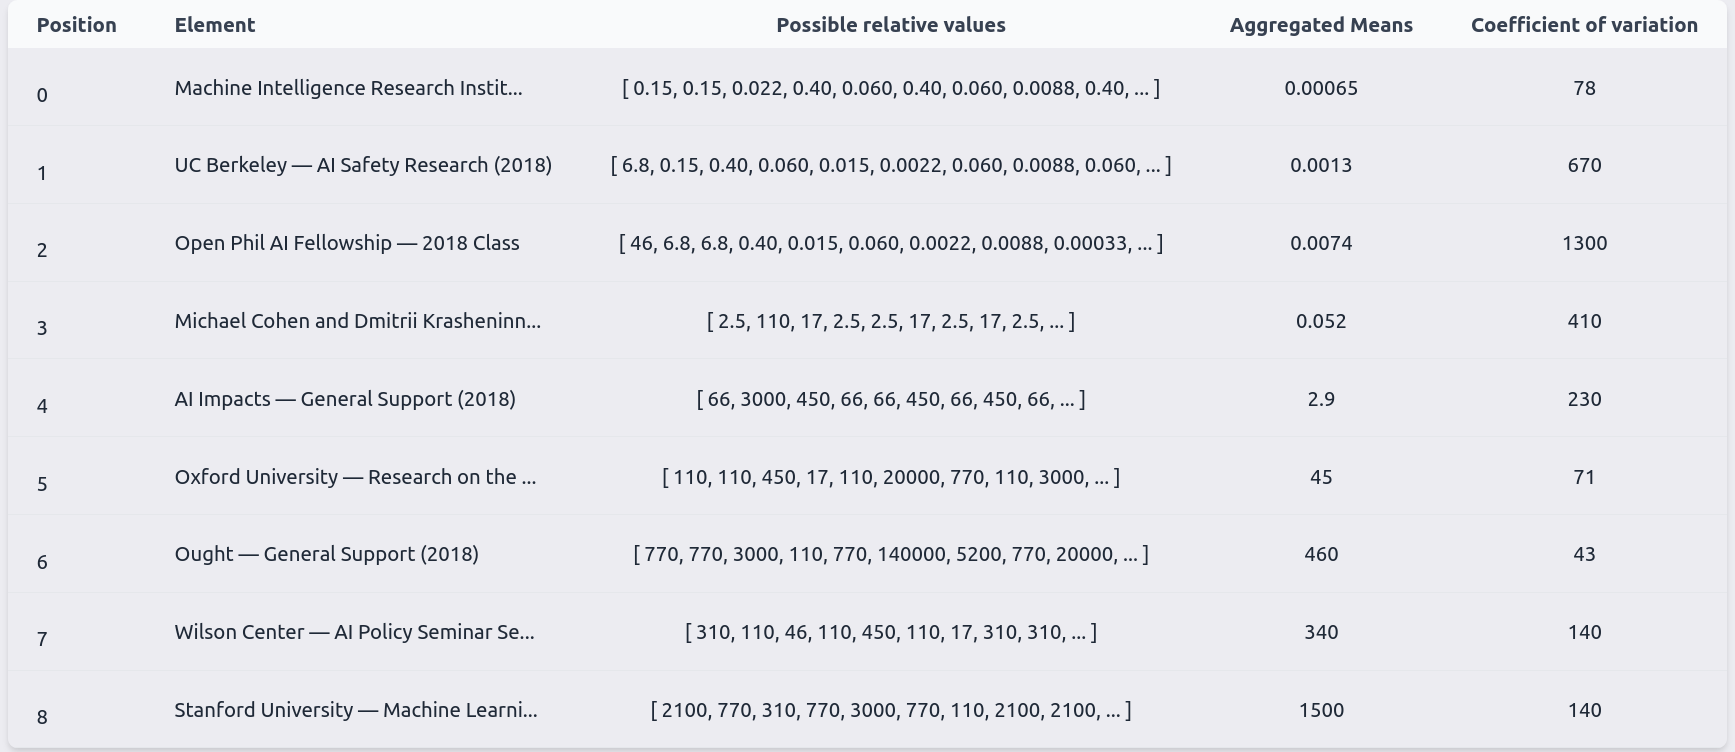
and on the other hand doing some fast and clever mean aggregation 1:
Initially, users could only input numbers, e.g., "A is 3 times better than B". But now, users can also input distributions, using the squiggle syntax, e.g., "A is 1 to 10 times better than B", or "A is mm(normal(1, 10), uniform(0,100)) better than B".
If you want to use the utility function extractor for a project, we are happy to add a page for your project, like utility-function-extractor.quantifieduncertainty.org/your-project.
Built with
Usage
Navigate to utility-function-extractor.quantifieduncertainty.org/, and start comparing objects.
You can change the list of objects to be compared by clicking on "advanced options".
After comparing objects for a while, you will get a table and a graph with results. You can also use the utility tools package to process these results, for which you will need the json of comparisons, which can be found in "Advanced options" -> "Load comparisons"
Notes
The core structure is json array of objects. Only the "name" attribute is required. If there is a "url", it is displayed nicely.
[
    {
        "name": "Peter Parker",
        "someOptionalKey": "...",
        "anotherMoreOptionalKey": "...",
    },
    {
        "name": "Spiderman",
        "someOptionalKey": "...",
        "anotherMoreOptionalKey": "..."
    }
]
The core structure for links is as follows:
[
    {
        "source": "Peter Parker",
        "target": "Spiderman",
        "squiggleString": "1 to 100",
        "distance": 26.639800977355474
    },
    {
        "source": "Spiderman",
        "target": "Jonah Jameson",
        "squiggleString": "20 to 2000",
        "distance": 6.76997149080232
    },

]
A previous version of this webpage had a more complicated structure, but it has since been simplified.
Contributions and help
We welcome PR requests.
License
Distributed under the MIT License. See LICENSE.txt for more information.
To do
- Extract merge, findPath and aggregatePath functionality into different repos
- Send to mongo upon completion
- Push to github
- Push to netlify
- Don't allow further comparisons after completion
- Paths table
- Add paths table
- warn that the paths table is approximate.
- I really don't feel like re-adding this after having worked out the distribution rather than the mean aggregation
- On the other hand, I think it does make it more user to other users.
- Change README.
- Add functionality like names, etc.
- I also don't feel like doing this
- Look back at Amazon thing which has been running
- Simplify Graph and DynamicSquiggleChart components
- Add squiggle component to initial comparison?
-
The program takes each element as a reference point in turn, and computing the possible distances from that reference point to all other points, and taking the geometric mean of these distances. This produces a number representing the value of each element, such that the ratios between elements represent the user's preferences: a utility function. However, this isn't perfect; the principled approach woud be to aggregate the distributions rather than their means. But this principled approach is much more slowly. For the principled approach, see the
utility-toolsrepository. ↩︎